

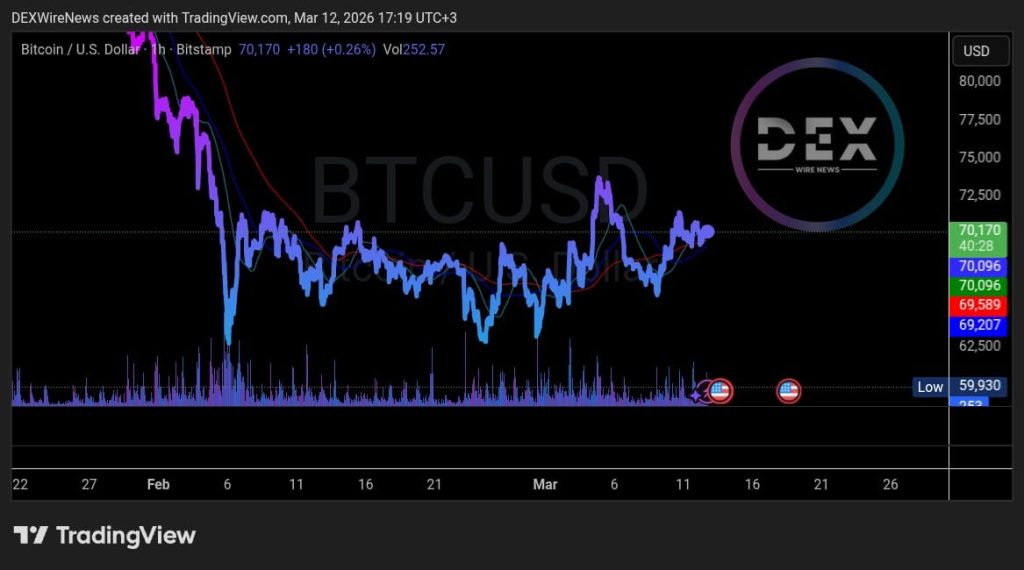
Bitcoin (COIN: $BTC) has clawed back 17% from multi-year lows below $60,000, reaching around $74,000 in early March 2026 amid returning demand signals. On-chain data shows buyers regaining control in derivatives markets, but analysts stress the broader downtrend persists until a decisive break above the $78,000 true market mean.
Buyers Regain Control in Derivatives
Net taker volume (aggressive buys minus sells in futures/perps) has stayed positive since the U.S.-Israel-Iran conflict intensified, per CryptoQuant. This metric, smoothed by a 30-day moving average, flipped bullish, indicating taker buy volume has consistently outpaced sells.
Coinbureau CEO Nic noted: “Bitcoin buyers are in control,” highlighting the shift as demand returned across derivatives. The Bull Score Index (CryptoQuant’s composite of fundamentals and technicals) jumped from 10 (extra bearish) on March 6 to 30 (highest since late October 2025), moving the phase from “extra bearish” to “bearish”, confirming a bear market relief rally rather than a new bull cycle.
Spot Bitcoin ETF inflows reinforced this, with three straight days of net buys totaling $529.2 million, absorbing selling pressure.
$78K: The Critical Barrier
BTC has consolidated in a $62,000–$72,000 range for over four weeks, with repeated failures to sustain above $70,000. Glassnode data shows price trapped between the realized price (~$54,400, average cost of all coins) and true market mean (~$78,000, cost basis of actively transacted coins).
This sandwich mirrors 2023 behavior, where relief rallies were repeatedly rejected at the true market mean before the October 2023 breakout (catalyzed by ETF approvals). Glassnode warns: repeated failures above $70,000 tilt mid-term returns downward, with $54,000 as primary support.
Trader Titan of Crypto emphasized: a break above $78,000–$80,000 would signal a long-term trend change. Until then, upside remains capped in the absence of major catalysts.
Support Levels to Watch
Key downside zones include:
- 200-week EMA (~$68,300)
- $60,000–$65,500 demand cluster
- 200-week SMA (~$58,800), historical last line of defense in macro drawdowns
Verdict
Buyers are dominant in the short term, driving a solid relief rally with positive on-chain and ETF signals. However, the macro trend stays bearish until $78,000 (true market mean) breaks decisively.
A clean close above this level would shift the outlook bullish and open higher targets; failure to reclaim it keeps the range-bound/downside tilt intact. Monitor ETF flows, conflict headlines, and upcoming CPI/PCE data; they could tip the balance.
Click Here for Updates on BTC – It’s 100% FREE to Sign Up for Text Message Notifications!
Disclaimer: This website provides information about cryptocurrency and stock market investments. This website does not provide investment advice and should not be used as a replacement for investment advice from a qualified professional. This website is for educational and informational purposes only. The owner of this website is not a registered investment advisor and does not offer investment advice. You, the reader / viewer, bear responsibility for your own investment decisions and should seek the advice of a qualified securities professional before making any investment. Please read our Full Disclaimer: https://dexwirenews.com/disclaimer/