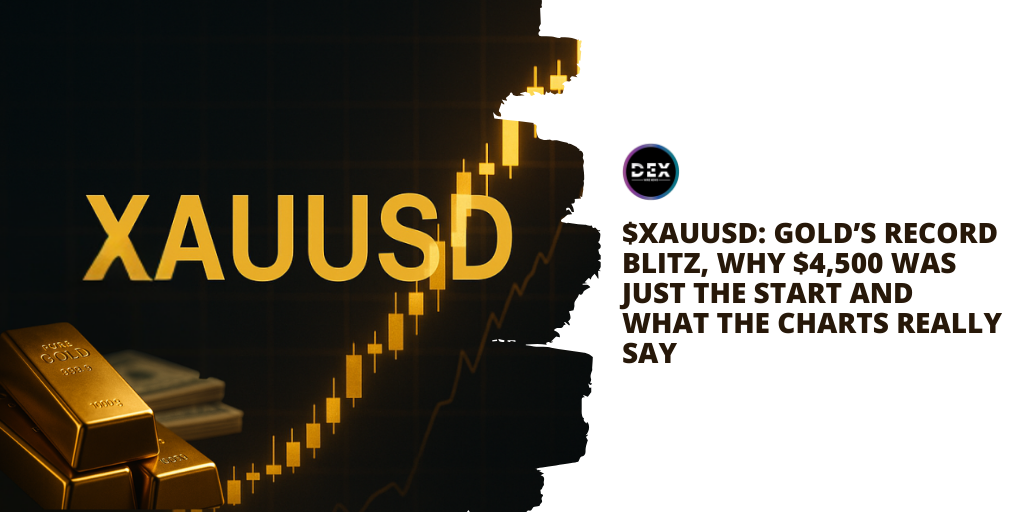
Gold ($XAUUSD), which is the price of gold in U.S. dollars, did more than rise this year. It surprised the market by breaking above $4,500 per ounce, marking one of the strongest gold rallies in decades. Prices reached around $4,530 at the high, then pulled back slightly as some traders took profits while others continued buying.
This move is not just a normal year-end push. It shows bigger changes happening in the global market. Currencies are weakening, risks are rising, and investors are moving money into safe assets like gold as 2025 comes to an end.
What stands out most is how strong this move has been. Gold is up over 70% this year, its best yearly performance since the late 1970s. Even while stocks and other markets move up and down, investors have stayed confident in gold.
What’s Driving Gold’s Historic Rally Now
Unlike a short-term move, gold’s surge above $4,500 comes from multiple reinforcing forces.
First, safe-haven demand continues to build as geopolitical tensions, including flare-ups in energy markets and global diplomatic uncertainties, make gold attractive as an insurance asset in times of risk.
At the same time, expectations of further Federal Reserve rate cuts in 2026 have reduced the appeal of yield-bearing assets. When real yields fall or remain low, gold often becomes comparatively more attractive because it doesn’t have an interest component but holds value during uncertain policy phases.
The U.S. dollar’s decline has also played a big role. A softer dollar makes gold relatively cheaper for holders of other currencies, pulling in global buyer interest and mechanically lifting prices.
Central banks continue to increase gold reserves and fixed-income diversifiers, while ETF inflows have topped record levels, including strong retail and institutional participation, further tightening physical supply and supporting price gains.
Simultaneously, other precious metals like silver and platinum have gone parabolic, with silver rising past $75 per ounce for the first time, indicating a broad commodities strength rather than isolated bullion trading.
Technical Analysis: Chart Patterns and Key Levels to Watch
From a trader’s perspective, several chart features reinforce that this isn’t just a flash move:
Analysts note that gold has maintained a longer-term ascending channel, making higher highs and higher lows, a classic bullish structure. Even recent pullbacks have generally found support within this channel, suggesting that sellers aren’t strong enough to shift trend dominance.
On the daily and weekly charts, key resistance zones near $4,525–$4,567 are now focal points. A sustained break above these levels on healthy volume could open the path toward psychological and technical targets above $4,600 and even higher.
Support structures also provide clear reference points for charting: near-term support clusters around $4,420–$4,450, while deeper support lies closer to previous psychological zones around $4,200 during pullbacks.
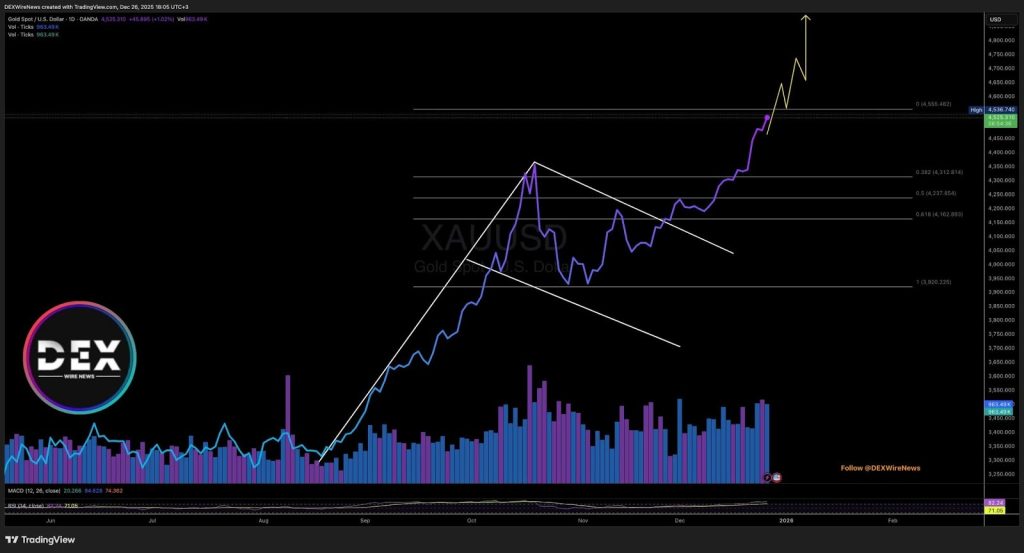
Momentum indicators like the Relative Strength Index (RSI) are in overbought territory, meaning short-term corrective moves or sideways action are possible before new highs are tested. Overbought readings are typical in strong uptrends, often signaling pauses rather than reversals when fundamentals remain supportive.
On lower timeframes, traders are watching demand zones near $4,470–$4,465 as a key area that helps determine whether bulls stay in control or a deeper pullback begins. A break below this zone might lead to testing support near $4,400 or lower.
In short, the technical picture shows trend continuity with room to run, but also shows important short-term congestion and profit-taking potential as gold inhabits historically extreme price territory.
Real Market Forces Behind the Numbers
Beyond charts, the gold rally reflects real economic pressures. Markets are pricing in a scenario where traditional assets like bonds and cash are less attractive due to low real interest rates and persistent uncertainty, while gold offers capital preservation and hedging against currency pressures.
The surge this year has been broad, with annual gains exceeding 70%, which markets haven’t seen since inflation-era rallies in the late 1970s. This puts gold into a rare historical company and suggests that the current move isn’t trivial market noise but a structural repricing of bullion.
Central bank accumulation, particularly from major holders like China, India, and other emerging market nations, along with record ETF inflows, have tightened available supply in the physical market, reinforcing price gains even when traders take profits.
Global political and fiscal uncertainty, from trade tensions to regional conflicts and debt sustainability concerns, continues to feed safe-haven demand. Every geopolitical flare-up or currency weakness appears to be met with renewed interest in gold and other precious metals, rather than quick rotation back into risk assets.
What This Rally Means for Early 2026
Looking ahead, markets generally expect that the macro forces boosting gold won’t disappear overnight. Analysts believe the combination of potential further Fed easing, weaker dollar trends, and persistent geopolitical uncertainty could keep supporting prices well into 2026. Many forecasts anticipate gold staying elevated between $4,500 and $4,700, and some even project breaks above $5,000 if the trend persists.
That doesn’t mean a straight climb: strong rallies often include periods of consolidation or pullbacks, especially after new record highs. Traders and investors will be watching how gold reacts near key technical layers and in response to policy news, inflation prints, and changes in real yields. Corrections are normal and often healthy, especially after strong multi-month runs, but they don’t necessarily signal a reversal as long as major supports hold.
The technical setup supports continued bullish bias, with clear resistance levels to watch and established support zones for traders drawing their charts.
Whether you’re a trader looking at short-term zones or a long-term investor positioning for macro shifts, gold’s record run stands out as one of 2025’s most defining market developments, showing how precious metals can dominate headlines and portfolios even as other assets fluctuate.
Click Here for Updates on GOLD – It’s 100% FREE to Sign Up for Text Message Notifications!
Disclaimer: This website provides information about cryptocurrency and stock market investments. This website does not provide investment advice and should not be used as a replacement for investment advice from a qualified professional. This website is for educational and informational purposes only. The owner of this website is not a registered investment advisor and does not offer investment advice. You, the reader / viewer, bear responsibility for your own investment decisions and should seek the advice of a qualified securities professional before making any investment. Please read our Full Disclaimer: https://dexwirenews.com/disclaimer/